Visual Content Strategy: Build Brands That Get Noticed
Key Takeaways
- Visual content strategy is a documented plan for using images, video, and graphics to hit specific marketing goals.
- The human brain processes visuals roughly 60,000 times faster than text, making visual formats essential for capturing attention.
- Different visual formats serve different purposes: video builds trust, infographics simplify data, images trigger emotion.
- Measuring performance through clear KPIs separates brands that grow from brands that guess.
- Consistency in visual identity compounds over time, building recognition that paid ads can’t replicate.
- As of 2026, short-form video and interactive visuals are the dominant formats across every major platform.
Visual Content Strategy: Build Brands That Get Noticed
A visual content strategy is a documented plan for using images, video, infographics, and other visual formats to achieve specific marketing goals across chosen platforms and audiences.
What Is a Visual Content Strategy?
A visual content strategy is the architecture behind every image, video, and graphic your brand publishes. It’s not just picking pretty pictures. It defines which visual formats you’ll use, where you’ll publish them, who you’re speaking to, and how you’ll measure whether any of it worked. Think of it as the creative brief that never expires: a living document that keeps your visuals purposeful instead of decorative.
According to research cited by Canva’s visual marketing guide, truly shareable content is authentic, unique, and eye-catching. Without a strategic framework behind it, even beautiful content gets lost in the noise. There are over 4.2 million blog posts written every day, according to Acquia’s content marketing research. Standing out requires more than effort. It requires a plan.
Defining Visual Content
Visual content is any format that relies primarily on sight to convey a message. The main categories include:
- Images: Photographs, illustrations, and branded graphics that anchor storytelling and product presentation.
- Videos: Dynamic formats ranging from 15-second Reels to long-form documentaries, each serving a different stage of the buyer journey.
- Infographics: Data made digestible. Complex research becomes scannable, shareable, and memorable.
- Interactive content: Quizzes, augmented reality experiences, and interactive infographics that invite participation rather than passive viewing.
- GIFs and animations: Lightweight motion content that adds personality without the production cost of full video.
Why Visual Content Strategy Matters in 2026
Our brains are wired for images. Research shows that 90% of information transmitted to the brain is visual, and we process visual signals roughly 60,000 times faster than text. An MIT study found that the human brain can correctly identify an image after viewing it for as little as 13 milliseconds. That’s not a metaphor. That’s neuroscience with direct implications for how you market.
Beyond speed, visuals carry emotional weight that words struggle to match. Images evoke feelings more effectively than text alone, which means a well-chosen photograph or a precisely edited video clip can shift a viewer’s mood and, by extension, their purchasing behavior. Shoppers make product decisions in roughly 90 seconds, and according to Canva’s research, the majority of those decisions are driven by visual cues.
“Sight is our strongest sense: 90% of information transmitted to the brain is visual, and 40% of nerve fibers to the brain are connected to the retina.” – Kane and Pear, visual communication research
Benefits of a Strong Visual Content Strategy
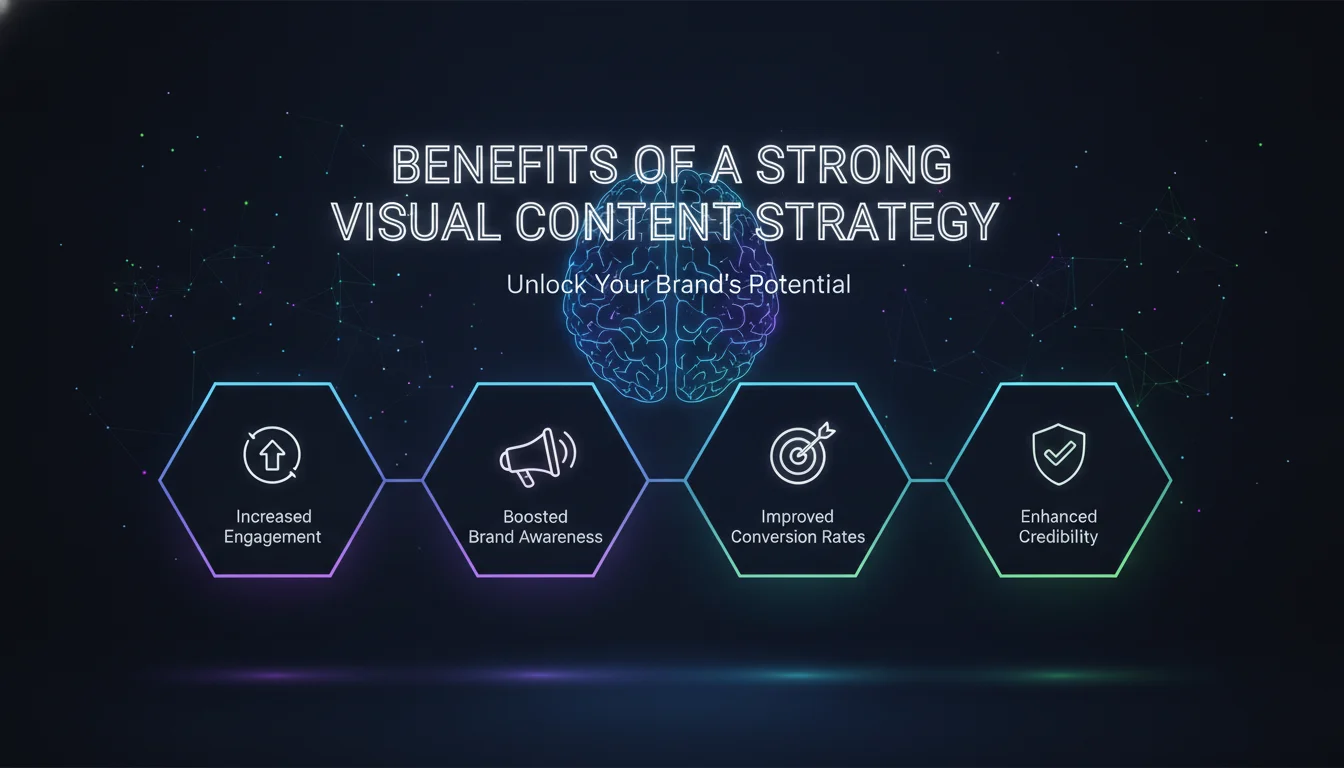
A well-built visual content strategy delivers compounding returns across engagement, search visibility, and revenue. Here’s what the data and creative industry experience consistently show.
Enhanced Engagement
Visual posts generate dramatically higher interaction than text-only content. Image posts attract 650% higher engagement than text-only posts, according to data referenced across multiple industry sources including Canva and Tower Marketing. That gap isn’t closing. If anything, as feeds grow more crowded, the visual advantage widens.
Improved SEO Performance
Search engines reward pages with engaging visual content. Optimized images and videos improve visibility in both standard search results and dedicated image and video search tabs. Descriptive file names, alt text, and captions all contribute to discoverability. Video content, in particular, creates a presence on YouTube, which functions as the second-largest search engine in the world.
Increased Conversion Rates
Visuals influence purchasing decisions at every stage of the funnel. A product is 85% more likely to be purchased when a customer watches a product video about it, according to research cited by Tower Marketing and Canva. That’s not a marginal lift. That’s a fundamental shift in how buying decisions get made.
Stronger Brand Recall
People remember what they see far longer than what they read. Consistent visual identity, repeated across platforms and formats, builds the kind of brand recognition that compounds over months and years. It’s the difference between a brand people recognize instantly and one they have to Google to remember.
Reduced Bounce Rates
Visual content keeps people on your site longer. Videos are especially effective at encouraging visitors to explore further rather than bouncing after a few seconds. More time on site signals relevance to search engines and gives your content more opportunity to convert.
How a Visual Content Strategy Actually Works
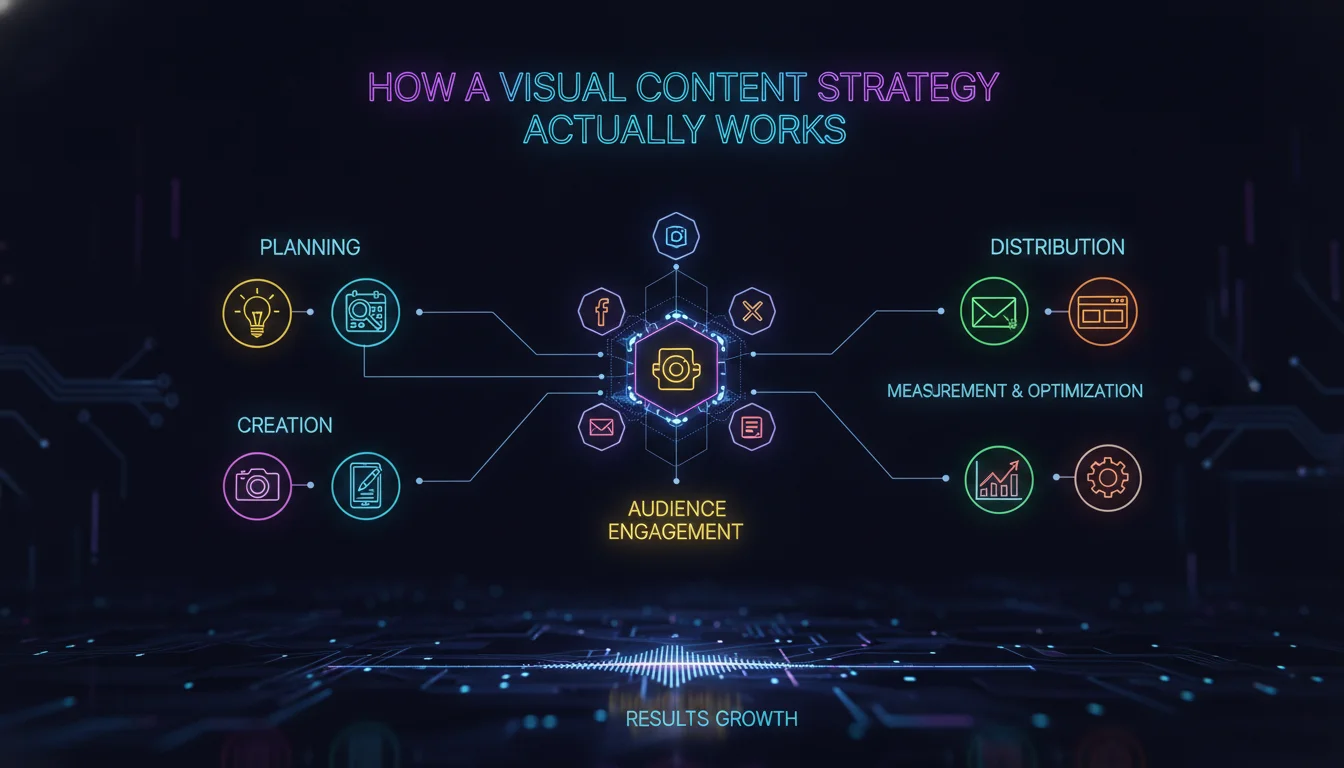
A visual content strategy works by aligning creative decisions with business objectives through a repeatable system of planning, production, distribution, and measurement. Most brands treat these as separate activities. The ones that win treat them as a single loop.
Here’s the underlying mechanics:
- Audience insight drives format choice. Different audiences consume different formats. A B2B audience on LinkedIn responds to data-rich infographics and thought leadership video. A consumer audience on Instagram responds to aspirational photography and short-form video. Your format decisions should follow your audience data, not your personal preferences.
- Brand guidelines create visual coherence. Color palettes, typography, photography style, and motion design rules ensure that every piece of content feels like it came from the same source. This coherence builds recognition over time.
- Platform algorithms reward native formats. Each platform favors content created specifically for it. Vertical video performs better on TikTok and Instagram Reels. Horizontal video performs better on YouTube. Repurposing without reformatting is a common mistake that suppresses reach.
- Distribution timing amplifies reach. Publishing great visuals at the wrong time is like opening a gallery at 3am. Audience behavior data tells you when your specific followers are most active and most receptive.
- Performance data closes the loop. Engagement rates, click-through rates, conversion attribution, and audience retention data tell you what’s working. That data feeds back into the next planning cycle, making each iteration smarter than the last.
“Sharing a branded graphic online and waiting for business offers to roll in is not a strategy. Neither is hinging your visual content success on creating the next viral phenomenon.” – Content Marketing Institute, 2025
Types of Visual Content and When to Use Each
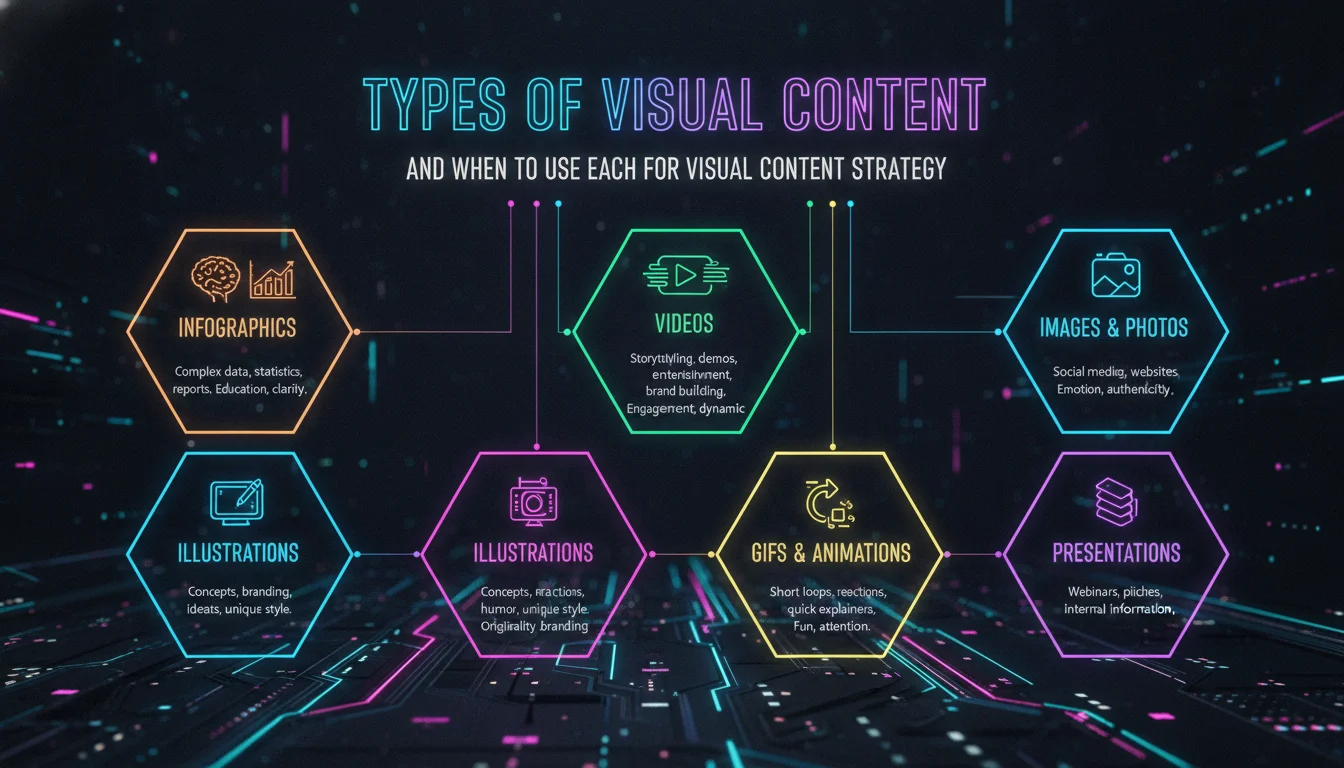
Each visual format has a distinct role in your marketing mix. Using the wrong format for the wrong goal is one of the most common and costly mistakes brands make.
Images
Images are the foundation of any visual approach. High-quality photography showcases products, tells brand stories, and triggers emotional responses. User-generated content and memes add authenticity and social proof. The key is intentionality: every image should serve a specific narrative purpose, not just fill space.
Video
Video makes up the majority of internet traffic, and as of 2026, short-form video continues to dominate platform algorithms. The format options include:
- Explainer videos: Break down complex products or concepts in 60-90 seconds.
- Product demos: Show the product working in real conditions, not just in a studio.
- Client testimonials: Social proof delivered in a human voice carries more weight than written reviews.
- Live streams and webinars: Real-time connection that builds trust and community.
- Short-form Reels and TikToks: High-reach, low-barrier formats that introduce brands to new audiences.
Infographics
Infographics translate data and research into visual narratives. They’re highly shareable, work well as blog assets, and perform strongly in image search. The best infographics don’t just display data. They tell a story with it, guiding the viewer’s eye from problem to insight to conclusion.
Interactive Content
Quizzes, polls, AR filters, and interactive infographics invite participation. They generate higher time-on-page metrics, collect first-party audience data, and create memorable brand experiences. Ally Financial’s “Your Money Personality” quiz, developed with The Atlantic and recognized at the 2024 Content Marketing Awards, is a strong example of interactive visual content driving both engagement and brand positioning.
Steps to Build Your Visual Content Strategy
Building a visual content strategy from scratch requires discipline before creativity. Here are the steps we use at Emin Media when developing visual frameworks for brand clients.
Step 1: Audit Your Current Visual Presence
Before creating anything new, document what already exists. Catalog your current visual assets across all platforms. Identify what’s performing, what’s inconsistent, and what’s missing entirely. This audit becomes your baseline and prevents you from rebuilding what already works.
Step 2: Define Your Audience With Precision
Broad audience definitions produce generic visuals. Go deeper. Identify your audience’s demographics, platform preferences, content consumption habits, and emotional triggers. The more specific your audience profile, the more targeted and effective your visual choices become. Tools like audience analytics dashboards, social listening platforms, and direct customer interviews all contribute to this picture.
Step 3: Set Measurable Goals
Every visual content plan needs clear objectives tied to business outcomes. Brand awareness campaigns measure reach and impressions. Conversion campaigns measure click-through and purchase rates. Community-building campaigns measure saves, shares, and comments. Define your KPIs before you create a single asset.
Step 4: Choose Your Formats and Platforms
Match your formats to your goals and your platforms to your audience. A brand targeting Gen Z needs a strong short-form video presence. A B2B software company needs LinkedIn-native graphics and data visualizations. Resist the temptation to be everywhere at once. Do fewer platforms exceptionally well before expanding.
Step 5: Build Your Visual Brand System
Develop a visual identity guide that covers color palette, typography, photography style, illustration style, and motion design principles. This system ensures that every piece of content, regardless of who creates it, feels cohesive. Consistency is what turns individual pieces of content into a recognizable brand presence.
Step 6: Create a Content Calendar
Map your visual content to a publishing schedule that accounts for platform-specific timing, seasonal relevance, and campaign cycles. A content calendar prevents the reactive, last-minute content creation that produces inconsistent quality and missed opportunities.
Step 7: Measure, Learn, and Iterate
Use analytics tools to track performance against your KPIs. Review data weekly for tactical adjustments and monthly for strategic shifts. The brands that improve fastest are the ones that treat every piece of content as a data point, not just a deliverable.
Visual Content Strategy Comparison: Formats at a Glance
Different visual formats serve different goals, audiences, and budgets. This table helps you choose the right tool for each situation.
| Format | Best For | Production Cost | Shelf Life | Top Platforms |
|---|---|---|---|---|
| Short-form Video | Awareness, reach, entertainment | Low to medium | Days to weeks | TikTok, Instagram Reels, YouTube Shorts |
| Long-form Video | Education, trust-building, SEO | High | Months to years | YouTube, website |
| Photography | Brand identity, product showcase | Medium | Months | Instagram, website, Pinterest |
| Infographics | Data storytelling, SEO, shareability | Low to medium | Months to years | Blog, Pinterest, LinkedIn |
| Interactive Content | Engagement, lead generation, data collection | High | Months | Website, social media |
| GIFs and Animations | Personality, social engagement | Low | Weeks | Twitter/X, Instagram, email |
Pros and Cons of Visual Content Marketing
A visual-first approach to marketing delivers real advantages, but it also comes with genuine challenges worth understanding before you commit resources.
Pros
- Dramatically higher engagement: Visual posts consistently outperform text-only content across every major platform.
- Faster message delivery: Visuals communicate complex ideas in seconds, reducing the cognitive load on your audience.
- Stronger emotional connection: Images and video evoke feelings that text rarely achieves, creating deeper audience relationships.
- Better SEO performance: Optimized visual content improves rankings in both standard and image-specific search results.
- Higher conversion rates: Product videos and high-quality imagery directly influence purchasing decisions.
- Compounding brand recognition: Consistent visual identity builds recognition that grows stronger over time.
Cons
- Higher production costs: Quality visual content requires investment in equipment, software, or professional talent.
- Time-intensive creation: Video production and professional photography take significantly longer than writing a blog post.
- Difficult to update: Unlike text, published videos and printed graphics are hard to revise once they’re live.
- Accessibility requirements: Visual content needs alt text, captions, and audio descriptions to be inclusive, adding production steps.
- ROI measurement complexity: Attributing revenue directly to visual content requires sophisticated tracking setups.
Best Practices for Visual Content Creation
Effective visual content creation follows principles that separate brands with genuine creative authority from those just filling a content calendar.
Maintain Visual Consistency
Consistent use of colors, fonts, and photography style reinforces brand recognition across every touchpoint. When someone sees your content in a crowded feed without reading your name, they should still know it’s yours. That level of recognition takes deliberate system-building, not just good taste.
Optimize Every Visual for Search
Use descriptive file names before uploading any image or video. Write alt text that describes the visual accurately and includes relevant keywords where natural. Add captions to videos, both for accessibility and because search engines index text. These small steps compound into meaningful SEO gains over time.
Design for Mobile First
The majority of social media consumption happens on mobile devices. Design visuals for vertical formats first, then adapt for desktop. Text overlaid on images should be large enough to read on a 6-inch screen without zooming.
Prioritize Authenticity Over Polish
As of 2026, audiences have developed a sharp instinct for content that feels manufactured versus content that feels real. Behind-the-scenes footage, user-generated content, and unscripted moments often outperform highly produced campaigns. Authenticity isn’t a style choice. It’s a performance strategy.
Common Mistakes to Avoid
Most visual content underperforms not because of bad creative, but because of avoidable strategic errors. Here are the ones we see most often.
Treating Visuals as Decoration
Adding an image to a blog post just to break up text is not a visual content strategy. Every visual element should serve a specific communicative purpose: illustrating a concept, evoking an emotion, demonstrating a product, or guiding the viewer’s attention. If you can’t articulate why a visual is there, it probably shouldn’t be.
Ignoring Platform-Specific Requirements
Posting the same image or video across every platform without reformatting is one of the fastest ways to suppress your organic reach. Each platform has different aspect ratios, caption lengths, and audience expectations. A LinkedIn carousel performs completely differently from an Instagram carousel, even if the content is identical.
Skipping the Strategy and Going Straight to Production
Many brands hire a videographer or photographer before defining their goals, audience, or distribution plan. The result is beautiful content that doesn’t move the needle. Production should always follow strategy, not precede it.
Neglecting Accessibility
Visual content without alt text, captions, or audio descriptions excludes a significant portion of potential audiences. Beyond the ethical dimension, accessibility features also improve SEO performance. There’s no good reason to skip them.
Measuring Vanity Metrics Only
Likes and follower counts feel good but rarely correlate with business outcomes. Track metrics that connect to real goals: click-through rates, lead form completions, video watch time, and conversion attribution. Vanity metrics tell you what people noticed. Performance metrics tell you what actually worked.
Producing Without a Content System
One great video or a single viral infographic won’t build a brand. Consistency over time is what creates compounding returns. Without a production system, a content calendar, and clear roles, most visual content efforts collapse within a few months when the initial enthusiasm fades.
A Real-World Scenario: How a Brand Might Apply This
Consider a mid-sized skincare brand launching a new product line. They have a modest budget, a small in-house team, and a goal of driving online sales within 90 days. Here’s how a structured visual content approach plays out.
Week 1-2: Audience and audit. The team reviews their existing Instagram and website analytics. They find that their highest-performing posts feature real customers using products in natural light, not studio shots. They identify their core audience: women aged 25-40 who value clean ingredients and sustainable packaging.
Week 3-4: Format and platform decisions. Based on audience data, they prioritize Instagram Reels for awareness and their website product pages for conversion. They decide against TikTok for now, choosing to do two platforms well rather than four platforms poorly.
Week 5-8: Production sprint. They shoot a series of short-form videos showing the product being used in real morning routines. They create three infographics explaining the key ingredients. They reach out to ten existing customers for user-generated content, offering product credit in exchange.
Week 9-12: Publish, measure, adjust. The Reels outperform their static posts by a significant margin. The ingredient infographics drive strong saves and shares. The user-generated content generates the highest click-through rate of any content type. They double down on UGC and reduce studio photography in the next cycle.
The result isn’t magic. It’s a system. Every decision connects back to a goal, an audience insight, and a measurable outcome. That’s what separates a visual content strategy from a content calendar.
Challenges in Visual Content Strategy
A strong visual approach delivers real results, but it also comes with challenges that require honest planning.
Resource Allocation
Creating high-quality visual content requires time, budget, and skilled people. Brands that underestimate this investment often produce inconsistent content that damages rather than builds brand perception. Start with fewer formats executed well, then expand as resources allow.
Staying Relevant
Visual trends move fast. What felt fresh in 2024 can feel dated by mid-2026. Regularly review what’s performing on your target platforms, follow creative industry publications like AdAge and Campaign, and build enough flexibility into your content system to incorporate new formats without overhauling everything.
Measuring ROI
Quantifying the return on visual content investment remains one of the harder problems in marketing. The solution is establishing clear KPIs before production begins, not after. When you know what you’re measuring, you can build the tracking infrastructure to capture it. Without that upfront clarity, you’re left with beautiful content and no way to prove it worked.
Visual Content Strategy: 2026 Outlook
This year, three forces are reshaping how brands approach their visual content plans.
AI-assisted production is lowering the cost and time required to create certain types of visual content, particularly graphics, animations, and short-form video scripts. This doesn’t eliminate the need for creative strategy. It accelerates execution for brands that already have a clear direction.
Authenticity over production value continues to be the dominant audience preference. Brands that invest heavily in polished, highly produced content while ignoring raw, real-time formats are consistently outperformed by smaller brands with genuine voices and consistent posting habits.
Interactive and immersive formats are growing. Augmented reality filters, shoppable videos, and interactive infographics are moving from experimental to expected, particularly for consumer brands targeting younger demographics. Brands that build competency in these formats now will have a meaningful head start as adoption accelerates.
According to HubSpot’s content marketing research, the majority of companies are actively investing in content marketing as a core growth channel. The brands that win aren’t necessarily the ones with the biggest budgets. They’re the ones with the clearest strategy and the discipline to execute it consistently.
Frequently Asked Questions
What is the 70/20/10 rule for content?
The 70/20/10 rule suggests that 70% of your content should be original and brand-owned, 20% should be curated from relevant external sources, and 10% should be directly promotional. This balance keeps your audience engaged without overwhelming them with sales messages, while still moving them toward conversion.
What is an example of visual content?
Visual content includes images, videos, infographics, GIFs, interactive quizzes, augmented reality filters, and data visualizations. Each format serves a different purpose: a product video builds purchase confidence, an infographic simplifies complex data, and a branded photograph reinforces identity. The best visual content strategies use a mix of these formats rather than relying on a single type.
What is the 3-3-3 rule for marketing?
The 3-3-3 rule is a content balance framework suggesting that content should be divided between educational, entertaining, and promotional purposes in roughly equal measure. It’s designed to prevent brands from over-indexing on self-promotion, which erodes audience trust over time. The specific ratios vary by brand and audience, so treat it as a directional guide rather than a rigid formula.
What is the 5-5-5 rule for social media?
The 5-5-5 rule suggests balancing your social media output across engaging content, audience-relevant content, and brand promotional content in equal parts. Like most content ratio frameworks, it’s a starting point rather than a prescription. The right balance for your brand depends on your audience’s expectations and your specific platform mix.
How do I measure the success of my visual content strategy?
Success measurement starts with defining KPIs before you create anything. Engagement rate, video watch time, click-through rate, conversion rate, and organic reach are the most useful metrics for most brands. Use platform-native analytics tools alongside a centralized dashboard to track performance across channels, and review data on a regular cadence to inform your next production cycle.
How much should a brand invest in visual content production?
Investment levels vary widely based on brand size, goals, and competitive context. The more useful question is: what’s the cost of not investing? Brands that treat visual content as optional are consistently outperformed by those that treat it as a core channel. Start with a realistic budget for two or three formats, execute them consistently, and scale investment based on what the performance data tells you.
Ready to build a visual identity that actually moves the needle? Contact Emin Media for a free brand consultation and let’s create something worth seeing.
Enjoyed this article?
Contact Emin Media for a free brand consultation and let's create something amazing together.
Get in TouchRelated Articles
Digital Marketing for Creatives: A Bold Guide
Digital marketing for creatives builds real visibility and sales. Learn strategies for social media, SEO,…
Branding & Design Agency Tips That Actually Work
Discover branding and design agency tips to choose the right partner, set clear goals, and…

Creative Agency Pitch Deck Tips That Win Clients
Master creative agency pitch deck tips that win clients in 2026. Learn storytelling, design, and…